
Daycare Occupancy Fell Last Winter: Seasonality or a Business Problem?

A winter dip is a question to investigate, not an explanation. Before accepting “families always leave in December,” check whether the same room, measured the same way, lost enrollment at the same time in other years—and whether its replacement enrollments actually arrived. One winter's recovery can be encouraging without proving that the next winter will behave the same way.
For a daycare buyer, the practical result should be a defensible operating assumption: which places are currently earning fees, which departures were internal room moves, how long vacancies lasted, and what cash buffer is needed if the expected recovery does not happen. A centre-wide percentage alone will not answer those questions.
Decide what the monthly number measures
Start with one defined group and one consistent measure. In the example below, the number is active full-time contracts at month end in an unchanged older-child group. Its assumed operational capacity is 24 throughout the year. That is a scenario input, not the legal maximum for every BC daycare room.
Month-end enrollment is a snapshot. It is not average enrollment across all billable days that month, and it is not the number of children who attended on a particular day. A child who remains enrolled during an absence may not represent a lost fee. A child who starts on the last day can appear in the month-end count while contributing little to that month's billed revenue.
Statistics Canada's April 2026 child care study explains a related measurement problem: enrollment can include full- and part-time children, while daily attendance and occupied full-time-equivalent spaces differ. Its cross-sectional national survey also cannot establish the month-by-month trajectory of a particular business. Use that measurement caution, not a national statistic as proof that your target centre's vacancies are normal.
If the actual room sells part-time schedules, add a separate contracted place-day measure with a documented denominator. Do not divide all unique children by licensed places and call the result comparable to a full-time-only room. Keep daily staffing and attendance records separate; a commercial occupancy calculation does not authorize a particular care arrangement.
Follow the same group through a full year
The hypothetical group begins September 2025 with 21 children. The following monthly closing counts reflect starts and departures from that group, including any transfers. They do not represent a real business, listing or JQ client.
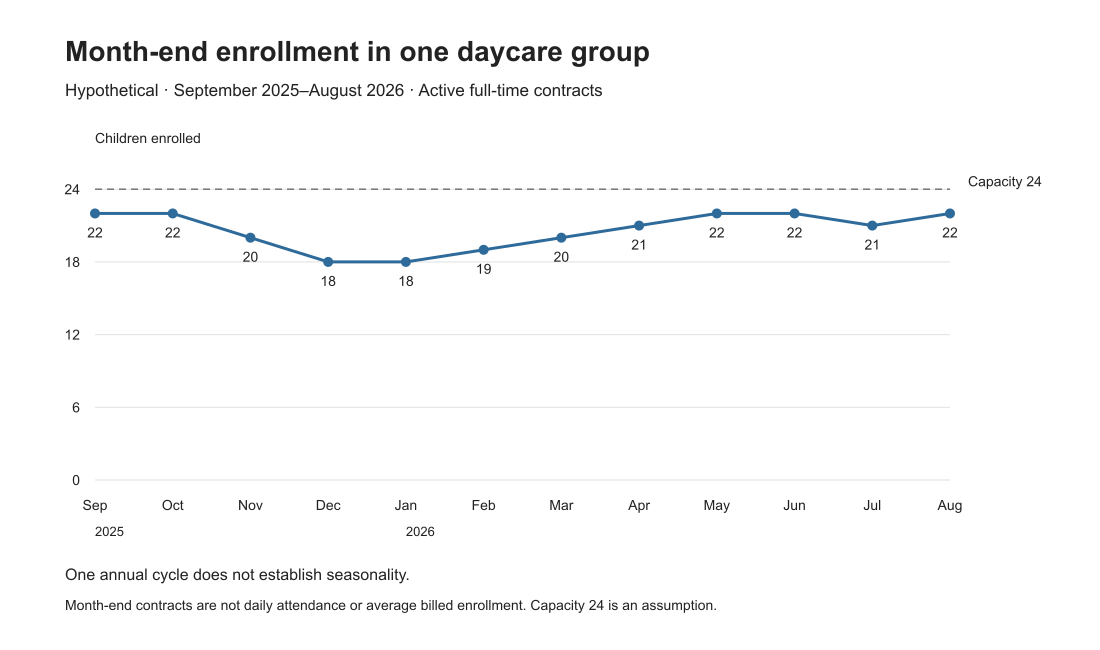
Hypothetical month-end full-time contracts, September 2025–August 2026. One annual cycle does not establish seasonality; the complete data table follows.
| Month | Opening contracts | Starts into group | Departures from group | Closing contracts |
|---|---|---|---|---|
| September 2025 | 21 | 2 | 1 | 22 |
| October | 22 | 1 | 1 | 22 |
| November | 22 | 0 | 2 | 20 |
| December | 20 | 0 | 2 | 18 |
| January 2026 | 18 | 1 | 1 | 18 |
| February | 18 | 2 | 1 | 19 |
| March | 19 | 2 | 1 | 20 |
| April | 20 | 2 | 1 | 21 |
| May | 21 | 2 | 1 | 22 |
| June | 22 | 1 | 1 | 22 |
| July | 22 | 1 | 2 | 21 |
| August | 21 | 2 | 1 | 22 |
The closing count falls from 22 to 18, a four-contract decline. Against the unchanged 24-place denominator, those snapshots are 91.7% and 75%, a 16.7-percentage-point decrease. This is not a 16.7% relative decrease: four divided by 22 is about 18.2%. The simpler description—four fewer contracts—is often the clearest in a small group.
The pattern recovers, but the flow table reveals something the line alone hides. November and December have no starts, while two children leave in each month. An investigation focused only on “why parents left” would miss the absence of incoming families.
Across the year there are 16 starts and 15 departures. The opening 21 plus that net gain of one reconciles to the final 22. If a seller's equivalent table does not reconcile, resolve the count definition or missing movements before interpreting its shape.
Separate departures from lost customers
Suppose the four November–December departures consist of one transfer to another group within the centre, one parent-reported relocation and two departures with no recorded reason. Only the first is established as an internal move; “unknown” should remain unknown. Do not fill the blanks with an attractive seasonal explanation or an unsupported accusation about care quality.
Connect anonymized movement records to enrollment end dates and the billing ledger through the seller's controlled review process. Public analysis needs aggregate counts and reason categories, not children's names, birth dates or medical information. Where a reason is parent-reported, identify it as such; it is not independently established causation.
Also record the incoming side: inquiries appropriate to this room, offers made for suitable start dates, acceptances and actual starts. A gap after predictable age transitions may point to weak intake timing rather than a collapse in neighborhood demand. Repeated declined offers after a change in hours may point to a different issue. Neither conclusion follows from the twelve numbers alone.
What would make a seasonal explanation stronger?
Compare the same calendar months in prior years using the same room definition, service hours and counting method. Mark changes in capacity, program, fees, staffing availability or temporary closures rather than drawing one continuous trend through unlike operations. An apparent occupancy improvement caused by reducing the denominator is not the same as enrolling more children.
Statistics Canada's 2026 explanation of seasonal adjustment describes seasonal patterns as recurring calendar-related movements. One complete annual cycle shows only one occurrence of each month. This example therefore remains an unadjusted descriptive chart; it is not a seasonal forecast or a statistical adjustment model.
If comparable history is unavailable, do not stop at “insufficient data.” Use the current contracts and documented start dates for the base case, and hold the proposed seasonal recovery outside that case until supported. Set a dated checkpoint for actual enrollments. The buyer can make a more cautious cash decision without pretending to know the cause of the dip.
Translate a confirmed shortfall into cash, not just percentages
The chart cannot calculate winter revenue loss because it shows month-end snapshots. For a separate sensitivity test, suppose billing records confirm an average shortfall of four full-time places for each of three whole months. Assume each occupied place earns a total $1,100 monthly program fee from all payers combined, and its absence avoids $150 of genuine variable costs. These are invented inputs, not BC fee limits, subsidy promises or quoted local economics.
The contribution shortfall would be four × three × ($1,100 − $150), or $11,400. The fixed rent and already-required staffing costs are not automatically saved because enrollment falls. The model assumes they remain unchanged. Do not add a government contribution again if it is already included in the total earned fee, and do not assume its timing matches parent payments.
Use the room trend and cash-sensitivity sheet (PDF) to keep the snapshot analysis and whole-month cash assumptions on separate pages of the decision. For broader demand checks, see daycare reputation, waitlists and occupancy. If you are evaluating an acquisition, contact JQ Properties with an anonymized monthly summary. A useful discussion starts with what changed and what the records support—not whether the curve looks reassuring.
By Justin Qiao, Personal Real Estate Corporation, Justin Qiao Group | RE/MAX Crest Realty.
Sources checked September 10, 2026.

